Universitas Negeri Semarang (UNNES) implements a structured, institutional carbon management process aimed at systematically measuring, monitoring, and reducing greenhouse gas (GHG) emissions across all campus operations. Formalized through Rector’s Decree Number B/3669/UN37/HK.02/2024 concerning UNNES’s Commitment to Achieving Carbon Neutrality by 2045, this framework supports Sustainable Development Goal 7 (Affordable and Clean Energy) and SDG 13 (Climate Action).
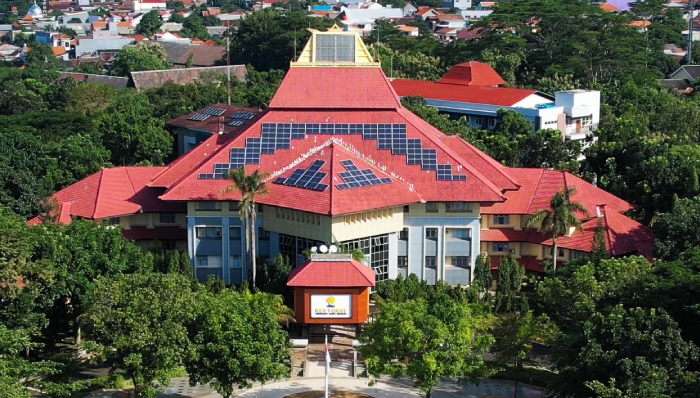
[image: Solar panels installed on Universitas Negeri Semarang buildings support renewable energy generation and contribute to reducing the university’s carbon emissions]
1. Institutional Carbon Management Process and Governance
Rather than relying on ad-hoc initiatives, UNNES executes a continuous four-stage carbon management cycle overseen by the Sub-Directorate of Conservation (Subdirektorat Konservasi) under the Directorate of General Affairs and Finance:
- Annual GHG Inventory and Accounting (Methodology & Scopes): UNNES calculates its institutional carbon balance annually using the GHG Protocol Corporate Standard integrated with the UI GreenMetric Carbon Footprint Guideline. The inventory covers:
- Scope 1 (Direct Emissions): Fuel consumption from official campus vehicles (Pertamax) and backup diesel generators (Pertamina Dex).
- Scope 2 (Indirect Energy Emissions): Purchased electricity from the national utility grid (PLN) across all campus buildings.
- Scope 3 (Other Indirect Emissions): Campus commuting mobility (staff and student vehicles) and organic/inorganic solid waste generation.
- Decarbonization Targets and Roadmap: Guided by Article Two of Rector’s Decree No. B/3669/UN37/HK.02/2024, UNNES targets Net-Zero Carbon Emissions by 2045, supported by phased intermediate milestones for renewable energy expansion, energy efficiency retrofits, and biological carbon sequestration (maintaining at least 40% green open space across campus areas).
- Annual Monitoring and Public Reporting: Emission data are audited annually, benchmarked against previous years to evaluate policy effectiveness, and published through UNNES’s SDGs and Sustainability Reporting portals.
2. Targeted Carbon Reduction Interventions
To actively lower emissions across Scopes 1, 2, and 3, UNNES implements coordinated operational interventions mandated in Rector’s Decree No. B/3669/UN37/HK.02/2024:
- Zero-Emission Campus Mobility: UNNES restricts conventional fossil-fuel vehicles within core academic zones, constructs dedicated pedestrian walking corridors, and operates a clean fleet comprising 5 electric shuttle buses, 4 electric golf carts, and 50 electric bicycles, supported by on-campus electric vehicle (EV) charging stations.

[Image: Electric shuttle buses provide environmentally friendly transportation for the campus community, helping reduce reliance on fossil-fuel-powered vehicles and lower transportation-related emissions]
- Renewable Energy Generation & Efficiency: Over 1,200 rooftop solar photovoltaic (PV) panels installed across 14 major campus buildings generate clean electricity to offset grid power and supply EV charging infrastructure, complemented by the systematic replacement of conventional appliances with energy-efficient LED and inverter technologies.
- Circular Waste Management: To mitigate methane and carbon emissions from solid waste, UNNES’s Integrated Waste Management Facility (TPST UNNES) processes campus organic waste into organic compost (aligned with UNNES’s annual production of 4,211 tonnes of compost / approximately 351 tonnes monthly) and cultivates 250 kg of Black Soldier Fly (BSF) larvae monthly for bioconversion.
3. Annual Carbon Footprint Results (2024 vs. 2025 Inventory)
UNNES regularly publishes its annual carbon balance to maintain accountability:
| Indicator | 2024 Inventory Baseline | 2025 Recorded Inventory | Notes / Methodology Alignment |
| Total Annual Carbon Footprint | 6,915.11 metric tons $\text{CO}_2\text{e}$ (corrected from decimal notation 6,915,109 kg) | 6,937.10 metric tons $\text{CO}_2\text{e}$ | Reflects a +0.32% adjustment due to expanded multi-campus utility & fuel inventory coverage (or ~12% reduction against Business-as-Usual projection without solar PV and EV interventions). |
| Per Capita Carbon Footprint | 0.125 metric tons $\text{CO}_2\text{e}$ / person | 0.140 metric tons $\text{CO}_2\text{e}$ / person | Remains classified as Low Emission Status for higher education institutions. |
| Primary Reduction Drivers | Solar PV (401.37 MWh) & Green Open Space (>40%) | Expanded Solar PV (~470–705 MWh), EV Fleet & Composting | Monitored annually by the Sub-Directorate of Conservation. |